
If we’re being honest for a moment, we were all mesmerized by the hockey stick shaped exponential growth charts in crypto token prices on CoinMarketCap.com in November and December of last year, and for some strange reason we all thought the party would never end.
Recently however, we’ve been brought back down to Earth with a persistent and relentless downturn in prices, which even the granddaddy of them all, Bitcoin has not been immune from. So what’s going on here? Why is this happening?
First a little history lesson. After every boom there is always a bust. Always! The early investors always profit from the late investors. It’s that simple.
We don’t even have to go that far back to remember what happened to property prices and the economy as a whole less than 10 years ago. And this time it will be no different, trust me. Only in crypto-land it will take place much, much faster. In fact it’s already here, since the recent drop in prices is no ordinary “correction” and here’s why:
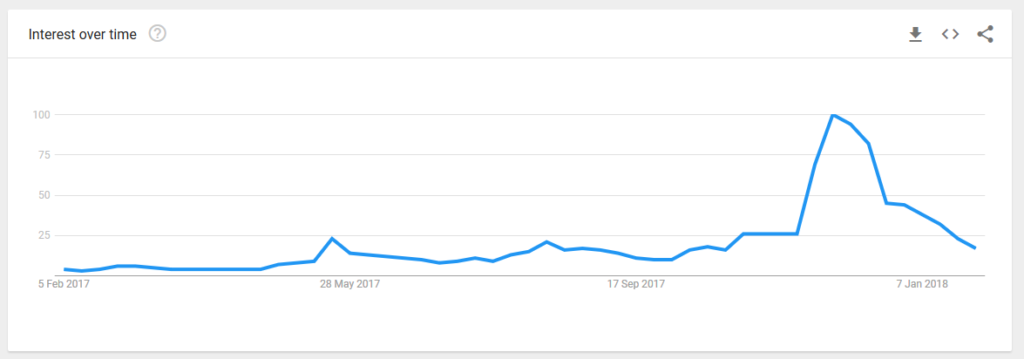
The only reason the prices of crypto tokens were going up like crazy throughout November and December 2017 was because there were tons of new buyers pouring in by the hundreds of thousands every single day. Bitcoin and other cryptocurrencies were the most talked about subjects on TV and at dinner tables across the word. But guess what? As the above chart shows, this is no longer the case.
The interest in Bitcoin has dropped very significantly after the new year and as the prices began to fall, new buyers were were no longer interested and this precipitated a further fall in price, which motivated “hodlers” to start selling. Here’s a quick chart to explain basic market psychology, that has proven true time and time again.
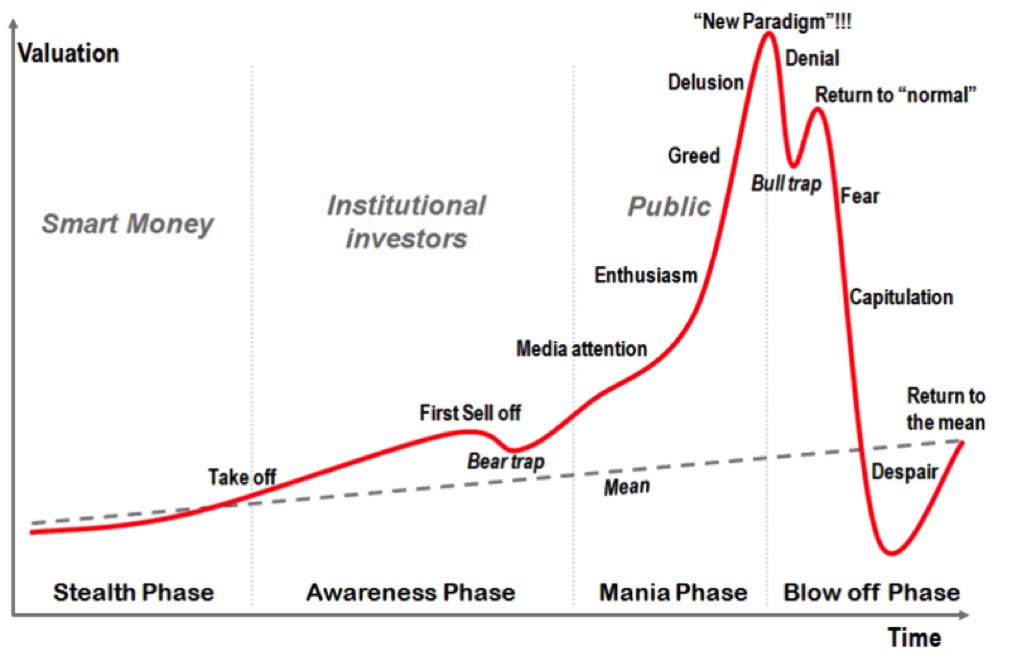
And now ask yourself, do you see any similarities between the two charts above! Do you think history is about to repeat itself?
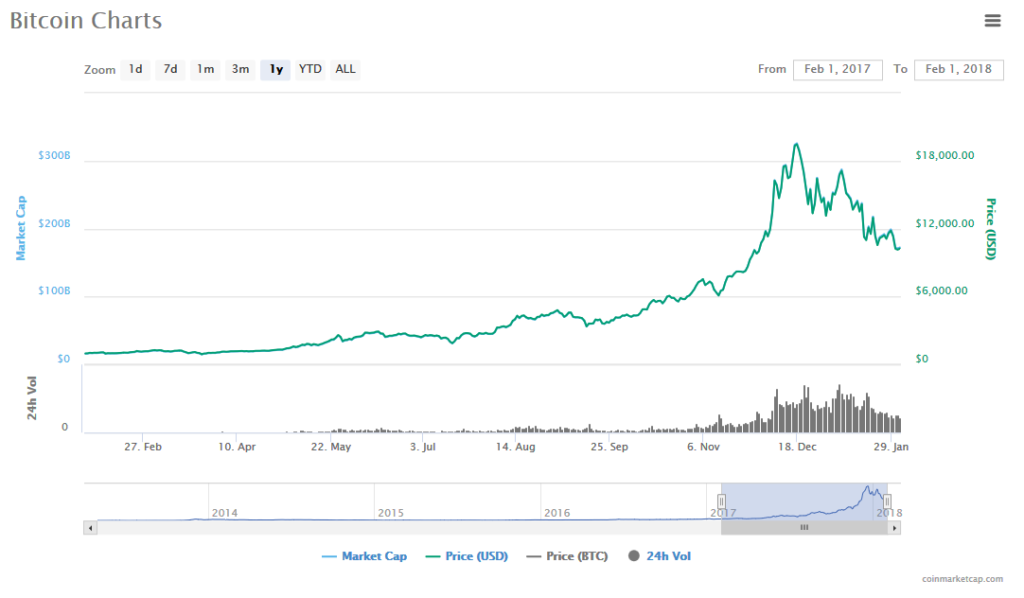
Since its all time high price of $19,909 on 17th December 2017, Bitcoin has lost almost half of its value and now the altcoins are feeling the pain too, with most of them loosing around 30-50% recently. Many new entrants into the crypto market have bought at all time high prices and have suffered devastating losses. Their stories of financial ruin will scare away many new investors and a bear market is now likely to follow. Keep in mind though that this “crypto-bear” won’t last as long as it does in traditional markets.
It’s moments like, when all hope seems lost, and when prices are in what seems like a perpetual free-fall, that will define you as the investor in the crypto economy. Are you a true believer in the blockchain revolution or did you just come along for the quick buck?
If you are the first, you will see this as a huge opportunity to add to your positions, whereas on the other hand, if you are the latter, you will run like the wind, until the next hype phase comes back. You will of course have missed the big opportunity and will again place yourself in a weak position by buying late.
Remember what Warren Buffett, one of the most successful investors of all time has said:
“Be fearful when others are greedy, and be greedy when others are fearful.“
This is not financial advice. Always do your own research. If you need help with the technical aspects of trading, please don’t hesitate to get in touch. We offer one on one consultations at very competitive rates.